The clock behind the cheque
A pharmaceutical company can have thousands of scientists and still pay billions for a biotech. The obvious question is why it did not invent the drug itself. The more useful question is what it would lose by trying.
In The Venture Math of Biotech, I looked at the investor’s side: ownership, dilution, capital and the time to an exit. This essay moves to the other side of the table. A buyer compares several ways to obtain a future product or capability. Each route comes with its own clock, uncertainty and claim on the eventual economics.
Merck provides a concrete starting point. In 2025, KEYTRUDA and KEYTRUDA QLEX generated $31.681 billion against $65.010 billion of group sales: 48.7%. Its 2025 filing identifies December 2028 as the expiry of Keytruda’s primary U.S. compound patent and says biosimilar competition could begin then. These are sales, not earnings, and a patent date is not a forecast that revenue falls to zero overnight.[1] The latest quarterly disclosure, for Q3 2026, reports $8.601 billion in KEYTRUDA/QLEX sales against $18.085 billion in group sales: 47.6%.[10]

The strategic problem is renewal. A discovery programme started today may be too early to address a particular portfolio gap. An external programme that has already completed relevant work may fit the calendar better. That does not make it a good deal at any price. It changes the comparison the price must survive.
Pharma pays for an improvement over its alternatives. Science becomes a transaction when that improvement can be defined, evidenced and owned.
External innovation is already part of the operating model
McKinsey’s January 2025 analysis reports that, since 2018, more than 70% of new-molecular-entity revenues have come from externally sourced products. It separately attributes roughly 65% of 2023 NME launches to external sources.[7]

External sourcing belongs in the base comparison. These observations do not prove that a transaction improves the science: buyers can select programmes after seeing evidence.
Five choices, with different rights attached
The choice is often described as build versus buy. That leaves out much of the actual design space. A company can license particular rights, contribute to a joint development plan, acquire an organisation, or keep its capital for a later decision.

Build: use a capability already inside the company
Internal development makes sense when the relevant team, knowledge and infrastructure exist, and there is enough time to use them. The cost includes experiments and failures, but also the other programmes those people cannot work on.
Pfizer’s nirmatrelvir effort illustrates internal execution. Its scientists describe moving from first laboratory synthesis in July 2020 to emergency use authorisation of Paxlovid in December 2021, a 17-month interval. Discovery, process chemistry and manufacturing had to work together.[2] This is an exceptional historical example, not a normal development-time assumption.
License: buy the rights you need
A licence can give a buyer access to a molecule without requiring it to own the rest of the company. Scope matters: territory, field, indications, manufacturing rights, sublicensing and future improvements can all change what is being bought.
In July 2025, Pfizer completed its licence with 3SBio for SSGJ-707, covering exclusive development, manufacturing and commercialisation rights outside China. The disclosure specified a $1.25 billion payment and a separate $100 million equity investment, plus an option concerning China.[3] A stake in the licensor and a licence to its product are different forms of ownership. For the wider competitive setting, Modality Commoditization and India’s Right to Win explores how access to familiar modalities changes the alternatives buyers can consider.
Co-develop: put complementary capabilities together
Sometimes each side has something difficult to reproduce. One may contribute a discovery or manufacturing system; the other may contribute an established treatment, clinical infrastructure or commercial reach. The agreement must decide who funds what, who makes decisions, and how the resulting value is shared.
Merck’s October 2022 exercise of its Moderna cancer-vaccine option involved a $250 million payment and a worldwide collaboration sharing costs and any profits equally.[4] It illustrates a structure in which both parties continue participating. Equal economics still require workable governance when development choices become difficult.
Acquire: bring a wider bundle under one owner
An acquisition can bring the asset together with the team, intellectual property, infrastructure and future pipeline. It also brings the obligation to decide what to keep, integrate or stop. If the organisation’s working knowledge is essential, a contract for a molecule alone may be insufficient.
AbbVie announced its Capstan acquisition in June 2025 for up to $2.1 billion in cash at closing, subject to adjustments. The announced scope included CPTX2309 and its targeted lipid nanoparticle platform. Completion followed in August.[5][6] That scope illustrates why a buyer might want both a lead programme and the capability behind it. The Address Problem develops the delivery question behind this example: what is a useful payload worth if it cannot reach the right cells?

Wait: keep the option to decide later
Waiting can be sensible when an upcoming result will resolve a consequential uncertainty. But it has a cost: stronger evidence can attract competing bidders, change the seller’s price, or close access entirely. An option agreement can purchase a defined future choice, with a price and conditions of its own. Walking away remains a valid decision if none of the available paths creates enough value.
The buyer’s equation, without the spreadsheet fog
Start with a deliberately small model. Imagine two ways to reach the same future opportunity. On success, each route produces an assumed value of $3 billion at its stated future date. This is an aggregate value at that date, not annual sales.
Costs below are already probability-weighted and stated in today’s dollars. Do not discount them again.
| Input | Build | External |
|---|---|---|
| Value on success | 3,000 | 3,000 |
| Success probability | 20% | 30% |
| Years to that value | 7 | 4 |
| PV of expected costs | 200 | 300 |
| Discount rate | 12% | 12% |
| Value before deal price | $71.4m | $272.0m |
Build gives 0.20 × 3,000 ÷ 1.12⁷ − 200 = $71.4 million. External gives 0.30 × 3,000 ÷ 1.12⁴ − 300 = $272.0 million. The external route costs more to finish, yet produces about $200.6 million more value before any payment for access.

If the buyer pays $150 million today for that external route, the remaining modelled advantage is about $50.6 million. Pay $200.6 million and it disappears. Pay more, and building wins within this simplified comparison.
That is not a recommended bid ceiling. The actual best alternative could be another licence, a different indication, or no investment. A full model dates and risk-adjusts development spending, product cash flows, taxes and contractual payments separately. It also accounts for integration, retained rights, competition and the resources displaced by the deal.
The model’s useful lesson is narrower: buying completed learning and earlier access can be worth more than the extra development cost. The premium only makes sense relative to a credible alternative.
How much room is there for a deal?
Build stays at 20%, seven years and $200m expected costs. Success value stays at $3,000m and discount rate at 12%. Change the external route below.
Default: external value $272.0m before price; $122.0m after a $150m price; advantage over build $50.6m.
All inputs are invented teaching assumptions. The displayed formula generates every result. Royalties, milestones and integration costs are excluded; a licence requires a separate model of retained economics.
Why a clinical-stage label cannot supply the price
The Q3 2026 J.P. Morgan / DealForma report shows upfront licensing medians rising with clinical maturity: $185 million at Phase I, $363 million at Phase II and $450 million at Phase III. But those categories contain just five, two and three deals respectively.[8]

The higher later-stage medians are consistent with buyers paying for more advanced evidence in this sample. They do not measure what the same asset gains by advancing a stage. Rights, indication, competition and transaction mix differ, and two or three late-stage deals cannot establish a universal pricing curve.
Time and learning do different jobs
The example gives the external route two advantages: earlier arrival and a higher assumed probability. Separate them before attributing the price to either one.
Keep the external probability at 30%, costs at $300 million and all build inputs fixed. Move only the date at which the external route reaches the $3 billion success value. Its advantage shrinks as that date moves out.

Now hold both routes at seven years. If external success probability also falls to 20%, it is worth $100 million less than build: the only difference is its higher cost. Restore the external probability to 30%, and its pre-price advantage at seven years becomes about $35.7 million. Move it back to four years, and the advantage returns to $200.6 million.
In practice, learning and time often arrive together. A programme may have completed a useful trial while the buyer’s internal alternative has barely started. But a later stage does not automatically mean better evidence for every question. A result may reduce uncertainty about dosing while leaving efficacy, manufacturing or access unresolved.
External sourcing is not automatically faster. McKinsey’s 2025 analysis reports that assets co-developed from Phase I to launch took about 3.6 years longer than internally developed assets in its historical comparison. Buying a programme’s past progress can shorten the buyer’s remaining path, even while coordination and integration slow subsequent work.[7]
There is also a commercial clock. Earlier arrival can matter because a competitor has not yet established a standard of care, a trial can still recruit, or a protected commercial window remains open. Those effects belong in the cash-flow and competitive assumptions. Simply shortening the discount period cannot represent all of them.
Commoditization changes the buyer’s alternative
The equation has another moving part: the alternative itself can improve while a biotech is developing its asset. A platform that once offered a scarce capability may later compete with internal teams, specialist service providers and other programmes built with similar tools.
Elliot Hershberg’s On Modality Commoditization, published in The Century of Biology in March 2025, describes how pioneering discovery technologies become widely available services. His antibody-discovery history connects that process to competition around validated targets and the rise of Chinese licensing alternatives.[12]
My Modality Commoditization and India’s Right to Win extends the argument into company and fund economics. On Biotech Platform Strategy — The Lineage follows how the source of advantage changes as tools spread. The implication for this essay is specific: a buyer needs a reason to pay for what remains difficult to obtain elsewhere.
More programmes around a target mean more comparisons
The historical crowding figure in Hershberg’s essay makes one part visible. Fougner and colleagues’ 2023 analysis reports a 5.4-fold increase in oncology assets per target between 2000 and 2022; the corresponding increases were 2.5-fold overall and 1.5-fold outside oncology.[13]

Crowding does not establish that the competing medicines are equivalent. Their safety, efficacy, tissue access, dosing and evidence can differ. It asks a practical question: which difference would matter enough for this buyer to choose our product? A familiar modality or target cannot answer that on its own.
A better alternative can shrink the premium
Return to the hypothetical external programme worth $272.0 million before its deal price. Against building at $71.4 million, it has $200.6 million of headroom. Now suppose another credible route offers $150 million of net value after its own costs and access payments. Our programme has not changed, but its advantage over the best alternative falls to $122.0 million.

At the earlier illustrative $150 million price, our programme delivers $122.0 million after payment. That still beats building, but loses to the new $150 million alternative. A seller can improve its own data and still face a tougher negotiation if competing options improve faster.
What this changes about build, license and acquire
As tools become accessible, building internally can become more credible, including through contracted services. Licensing can be attractive when a specific product has the evidence and rights a buyer needs. Co-development can combine capabilities that remain complementary. Acquisition needs a case for the additional control, team or reusable system being purchased. Commoditization changes these comparisons; it does not dictate one deal structure.
Nor does a cheaper discovery process guarantee a cheaper approved medicine. Clinical uncertainty, delivery, manufacturing and commercial execution still need to be resolved. The advantage may lie in a differentiated patient outcome, a hard-to-reproduce dataset, a delivery capability or a learning system that keeps improving. That is the connection to The Address Problem and The Recursive Discovery Factory: identify the bottleneck or accumulated learning a buyer cannot readily substitute.
For an Indian company, access to mature tools can reduce what must be invented from scratch. Whether that becomes a valuable product or an attractive investment still depends on differentiation, execution, capital consumed and ownership retained. A lower cost base can improve the company’s economics; it does not oblige a buyer to pay the valuation of an earlier platform pioneer.
Speed can become a time moat
This is where speed becomes an asset. When several teams can access the same discovery tools, the advantage can move to the team that reaches a useful decision sooner. A time moat is the period during which that team can produce valuable evidence or deliver a product before a credible rival can catch up.
There are different clocks inside that lead. Faster experiments can resolve a shared biological assumption before more capital is committed. Earlier clinical evidence can make a programme a credible option while competitors remain uncertain. Earlier market entry can reach patients and establish use before the next alternative arrives. Each matters only if the time saved changes a development or commercial outcome; generating more molecules per week does not establish any of them.
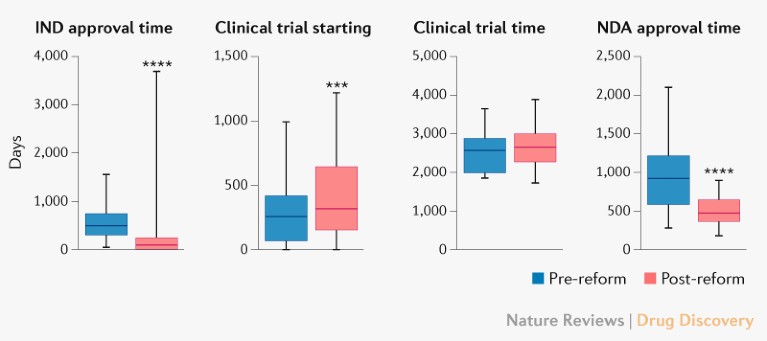
The distinction matters for the time moat. Faster permission to begin or market a drug can change a programme’s commercial timetable without compressing the biological observation a trial requires. This graph shows where a historical timing advantage appeared; it does not prove that every stage, every asset or every geography can reproduce it.
A buyer can therefore pay for work and learning it would otherwise need time to reproduce. The earlier example prices this explicitly: four years to the assumed outcome rather than seven. The next question is how much of that lead survives technology transfer, manufacturing scale-up, clinical trials and regulatory review. Buying an advanced starting point does not guarantee keeping its timetable.
The lead also has a shelf life. If commoditized tools let competitors reproduce the result quickly, a head start can expire before a product reaches the market. A stronger time moat renews itself: each cycle produces data, operational knowledge or a better experiment that helps the team complete the next cycle sooner. That is the connection to The Recursive Discovery Factory. The diligence question becomes: how long would a capable rival need to reproduce this result, and what will this team learn during that interval?
For the seller, speed can mean reaching a decisive milestone before cash runs out or a competing asset catches up. For the buyer, it can mean filling a portfolio gap while the opportunity is still useful. The asset being negotiated includes that time advantage, alongside the molecule, rights and capabilities. Its price depends on how much of the advantage the buyer can actually preserve.
The buyer asks both how good this programme is and what it could obtain instead. Commoditization changes the second answer.
Bio-AI software plays a different game
So far, the worked equation has valued a programme with a clinical outcome. That is only one business a bio-AI company can build. A company can sell access to a model or workflow, carry out discovery for a partner, or use its engine to develop medicines it owns. Putting all three under “AI biotech” hides who pays, what they receive and which risk the seller retains.
Hershberg also considers the possibility of computational design being sold as infrastructure, and the competition that can follow when models become more accessible.[12] My When Biology Becomes Information develops the resulting question: once a capability can be distributed as software, which parts of the business still earn a premium?

Game one: sell the tool
The customer buys a capability for its scientists: predictions, design, experiment planning, analysis or a workflow connecting them. Its alternative might be an internal tool, an open model with its own integration team, or another vendor. A software licence buys access under agreed terms; it does not by itself buy the supplier’s company, model weights or future molecules.
In July 2025, Latent Labs launched a browser-based platform for generating and ranking protein-binder designs. That historical launch illustrates access to design software as a product, rather than the sale of an approved medicine.[16]
The buyer needs evidence that the tool improves a real workflow. How long does it take to reach an experimentally validated result? How many failed experiments are avoided? What do compute, integration, validation, support and retraining cost? Saved scientist time can create useful capacity without automatically becoming a cash saving. A model benchmark or a high volume of generated sequences cannot settle the purchasing decision.
This business can earn subscription, usage or enterprise licence revenue before a drug is approved. Its commercial test includes adoption, renewal, expansion and the cost of serving customers. It still needs scientific credibility; recurring billing cannot substitute for useful predictions.
Game two: partner on a programme
Here the customer pays for work on a target, a candidate or a defined discovery outcome. The supplier contributes models, experiments and scientists. The agreement can include research funding, upfront consideration, milestones or royalties, with the exact rights negotiated programme by programme. Access to the software and ownership of the resulting candidate are separate questions.
Schrödinger’s November 2024 announcement with Novartis makes the distinction concrete: a multi-target research collaboration with $150 million upfront sat alongside an expanded three-year software agreement. One relationship contained both programme economics and software deployment.[15]
A hybrid can work, but the investor should examine both engines. Does customer work require substantial bespoke labour? Can the underlying software be reused? Do royalties compensate for rights surrendered, or merely make a small contract look like a large potential deal? Programme cash flows should not be counted again as software revenue when valuing the company.
Game three: own the medicine
An AI company that retains candidates and finances their development is taking therapeutic risk. The models can improve how it discovers and prioritises programmes, but toxicology, manufacturing, clinical evidence and commercial access still govern what those programmes become worth. The earlier risk-adjusted equation belongs here. Software-like gross margins on running a prediction are not the margins of developing and selling a drug.
The choice also changes the organisation and funding plan. Selling tools requires a product that customers can use and renew. Partnering requires delivery against scientific commitments. Owning medicines requires capital and capabilities to advance the assets. A company can combine them, provided it explains which activity creates the next unit of value and who funds it.
The moat is in what survives model replacement
A technical lead may win the first pilot. A durable software business needs reasons for the customer to keep using it as models improve elsewhere. Those could include reliable performance on the customer’s actual tasks, integration with experimental systems, accumulated validation, dependable operations or a feedback process that improves decisions. Switching costs are useful when they reflect a valuable working system; friction alone is a weak substitute for performance.
More users do not automatically create a data moat. Customer experiments may be confidential, and a vendor may lack permission to reuse them for training. The buyer and supplier must understand rights to inputs, outputs, models and improvements, including what happens when the agreement ends. My The Moat With No Floor examines the wider ownership problem around the discovery engine.
This brings us back to speed. A bio-AI system earns a time advantage when it repeatedly shortens the path to a useful, validated decision. It can lose that advantage when a rival model becomes easier to deploy or produces better experimental results. The stronger case is a learning loop whose measured performance improves with successive cycles, rather than a claim that model weights will remain scarce.
For pharma, the choice becomes: build a workflow, license software, commission a discovery programme, co-develop a capability or acquire the organisation behind it. The question underneath stays consistent: what will we gain, compared with our best alternative, and what must we own to keep that gain?
Buying five programmes may mean buying one shared risk
A platform can create a reusable capability. It can also create several programmes that all fail for the same reason. A buyer needs to know which is being offered. In On Biotech Platform Strategy — The Lineage, I examine the potential productivity of shared infrastructure. Here the task is to distinguish that productivity from genuine diversification.
Take five hypothetical programmes, each with a 20% chance of success. If their outcomes are independent, the probability of at least one success is 1 − 0.8⁵ = 67.232%.
Now suppose every programme needs one shared engine. The engine works with 40% probability. If it works, each programme independently has a 50% chance; if it fails, every programme fails. Each programme still has a 20% marginal chance: 40% × 50%. Yet the chance of any success is only 0.4 × (1 − 0.5⁵) = 38.750%.

Expected successes remain one in both cases. Dependence changes the distribution: a common failure can remove the entire portfolio. Real pharma portfolios can share risks too; size does not create independence.
This matters to the deal structure. A buyer may want one programme first, plus an option on others after delivery or biology is demonstrated. A seller may prefer to retain the platform and license a defined application. An acquisition can make sense when broader control is valuable, but it does not make the shared uncertainty disappear.
The informative experiment may therefore be the one that tests the common assumption. Five payload experiments cannot substitute for evidence that their shared delivery system reaches the required tissue at useful exposure and acceptable tolerability. The Recursive Discovery Factory asks the related operating question: what does each experiment teach the system that makes the next experiment more useful?
The price has to describe what is actually paid
A headline deal value is easy to remember and difficult to compare. Cash at signing, equity, contingent milestones, development commitments and royalties have different economic meanings. A dollar paid today is not the same obligation as a dollar paid only after an approval years away.
For a licence, the buyer’s cash flows must reflect the economics it actually keeps. Deduct royalties from the relevant sales stream; probability-weight and date milestones according to their triggers. Include the development costs it bears. The seller’s maximum possible receipts should not be subtracted as though every milestone were certain and payable today. The Harvest Illusion works through the distinction between headline licensing value and upfront cash in more detail.
For an acquisition, include the scope acquired and the cost of making it productive. A wider bundle can contain valuable capabilities and unwanted obligations. Control is useful when it improves execution or secures important rights; it is costly if integration disrupts the people and processes that created the opportunity.
Co-development requires the same discipline. Shared costs can make an ambitious programme feasible, but shared governance can slow decisions. Who chooses the next indication? Who can stop a trial? What happens when one party’s priorities change? The answers affect value alongside the scientific probability.
That is why a single universal “pharma hurdle” is misleading. The relevant comparison changes with the buyer, asset, rights, calendar and alternatives. Even strong evidence can support a poor transaction if the price transfers every dollar of the advantage to the seller.
What the biotech needs to make legible
A founder cannot control the buyer’s entire portfolio. A founder can make the company’s contribution easier to assess.
Start with the patient and comparator. What useful difference should the product establish? Then connect the next experiment to a decision. Would a positive result support a clinical plan, a licence, a manufacturing commitment or further platform investment? What would a negative result tell the team to stop?
Next, describe the capability honestly. Is the value concentrated in one molecule, in a repeatable way to make molecules, or in a team whose working knowledge matters? That answer helps determine which rights can be sold without damaging the company that remains.
The seller has a financing clock too
A buyer may be able to wait for the next trial. The biotech must pay to reach it. DealForma’s March 2026 review reports U.S. therapeutics-and-platforms funding of $18.5 billion across 256 rounds in 2025, versus $20.7 billion across 278 rounds in 2024. Both capital and round count declined.[9]

The updated history changes the story from recovery to a pullback. It does not tell us whether any particular company can raise money. For the founder, the practical question remains: can the company finance the evidence that would change a partner’s decision?
For more recent context, J.P. Morgan / DealForma reports $23.9 billion across 385 biopharma venture rounds globally through Q3 2026. That broader, partial-year measure is kept outside the U.S. annual comparison.[11]
Finally, make the timing credible. A milestone needs enough money to generate, analyse and explain the result, with room for the next financing or partnering process. A promising experiment that arrives after the company runs out of cash can leave the seller with very little choice.
The buyer and the investor can value waiting differently
Suppose an investor put in $2 million at inception and now owns 10%. A $500 million equity exit in year five gives that investor $50 million. If another round reduces the stake to 7.5%, a larger $600 million exit in year seven gives only $45 million.

At 7.5% ownership, the later exit must be about $666.7 million just to match the earlier $50 million in nominal proceeds. That still ignores the two-year delay and remaining failure risk. Waiting can create value, but the extra evidence needs to justify its capital, dilution and time. The Venture Math of Biotech develops the ownership arithmetic; The Studio Math of Biotech carries the timing question into company creation.
The investor’s equation and the buyer’s equation meet here. Investors need the evidence to arrive before dilution and time consume their economics. Buyers need the evidence to improve a specific choice at a defensible price. The company creates value when the same experiment makes both decisions clearer.
The question to ask before the next cheque is simple: which uncertainty will this money resolve, and whose decision will change when it does?
Sources and calculation notes
Public sources checked 11 November 2026. Historical examples are dated deliberately. Deal rationale beyond disclosed scope is interpretation, not access to internal deliberations.
- Merck, 2025 Form 10-K. Product sales table; Keytruda patent table and competition discussion. Figures describe 2025, not a 2026 forecast.
- Pfizer scientists, manufacturing nirmatrelvir (2023). Primary research describing discovery-to-manufacturing execution and the 17-month synthesis-to-EUA interval.
- Pfizer–3SBio, licensing completion (24 July 2025). Ex-China rights, $1.25bn payment, separate $100m equity investment and China option.
- Merck–Moderna, option exercise (12 October 2022). Historical agreement: $250m option exercise; equal costs and any profits. This is a deal-structure example, not a current clinical-status report.
- AbbVie–Capstan, acquisition announcement (30 June 2025). Up to $2.1bn cash at closing, subject to adjustments; includes lead programme and tLNP platform.
- AbbVie–Capstan, completion (19 August 2025). Confirms completion and inclusion of the candidate and platform.
- McKinsey, external innovation (9 January 2025). Revenue and launch measures, and historical co-development timing comparison.
- J.P. Morgan / DealForma, Q3 2026 report, p. 12. 2026 YTD Big Pharma in-licensing median upfront cash and equity. Original PDF and deal-count labels checked.
- DealForma, venture funding in 2025 (18 March 2026). Updated U.S. annual series for both 2024 and 2025. Replaces the earlier data vintage.
- Merck, Q3 2026 results (29 October 2026). Quarterly franchise and group sales; ratio calculated from reported values.
- J.P. Morgan, Q3 2026 activity (20 October 2026). Global venture year-to-date context. Different geography and period from the U.S. annual chart.
- Elliot Hershberg, On Modality Commoditization (16 March 2025). The Century of Biology. Strategic argument about discovery-tool diffusion, competition and changing sources of advantage; attributed interpretation, not a universal pricing law.
- Fougner et al., Herding in the drug development pipeline (28 April 2023). Nature Reviews Drug Discovery, Figure 1a and supplementary methods. Historical assets-per-target fold changes; does not measure transaction prices.
- Su et al., Trends in innovative drug development in China (2022). Original historical timing figure, reproduced as displayed in Hershberg’s March 2025 essay; bibliographic identity checked against PubMed PMID 35513561. The comparison does not establish uniform acceleration across development stages.
- Schrödinger–Novartis collaboration and software agreement (12 November 2024). Historical example separating a $150m-upfront research collaboration from an expanded three-year software agreement.
- Latent Labs, Latent-X platform launch (22 July 2025). Historical browser-based protein-design platform launch. Company-reported performance and current commercial terms are not used as independent validation.
The original diagrams and hypothetical calculations are explanatory models. They are not company forecasts, clinical estimates or asset valuations. Download plotted values and assumptions (CSV).